Help us make a difference in your community by making a tax deductible donation to the fire department.
2024 Response
Month
Fire
EMS
Jan
41
202
Feb
20
Mar
32
203
Apr
May
Jun
Jul
Aug
Sep
Oct
Nov
Dec
Total
93
405
2023 Response
Month
Fire
EMS
Jan
29
183
Feb
22
137
March
32
174
April
23
160
May
36
185
June
37
179
July
39
180
Aug
27
185
Sept
34
178
Oct
35
201
Nov
35
189
Dec
47
198
Total
396
2149
Past Responses
Year
Fire
EMS
2022
315
2140
2021
327
1919
2020
341
1804
2019
339
2302
2018
570
2358
2017
456
2503
2016
341
2483
2015
349
2653
2014
322
2721
2013
321
2613
2012
334
2587
Web Counters
Website Visitors Since January 17, 2014
1,951,762
Visitors Today
Apr 25, 2024
1,204
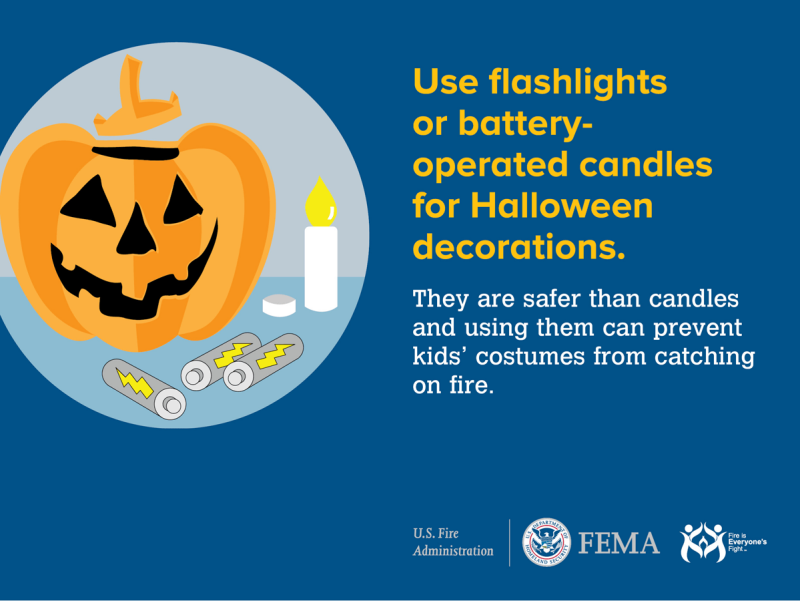
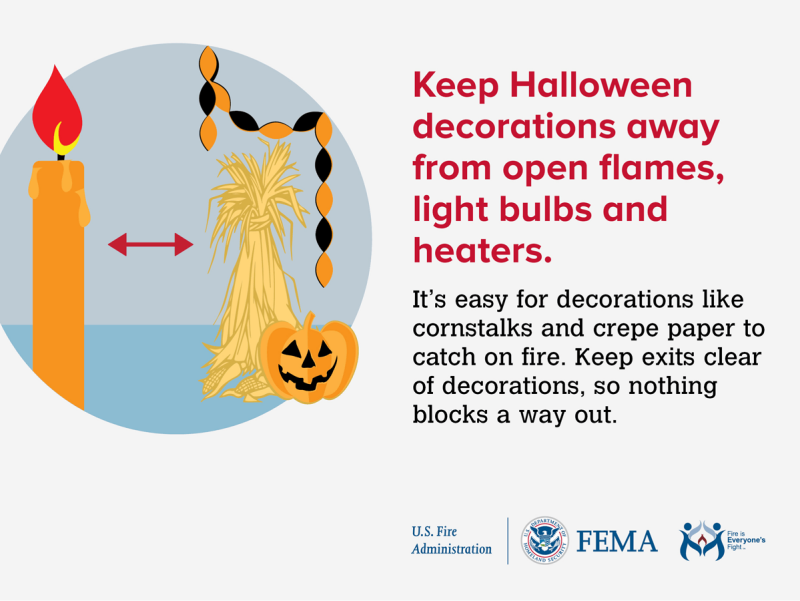
Halloween Fires
By MFC Fire Prevention Bureau
October 23, 2015
For each year from 2011 to 2013, an estimated 10,300 fires were reported to fire departments in the United States over a three-day period around Halloween and caused an estimated 25 deaths, 125 injuries and $83 million in property loss. In terms of numbers of Halloween fires, the largest general property type category was outside fires (38 percent) followed by residential fires (33 percent). Residential Halloween fires, however, resulted in the most deaths (94 percent), injuries (78 percent) and property loss (58 percent). Halloween fires occurred most frequently in the late afternoon and early evening hours, peaking during the dinner hours from 5 to 7 p.m. Fires then declined, reaching the lowest point during the early morning hours (4 to 7 a.m.). The leading causes of Halloween residential fires were cooking (44 percent), heating (15 percent), other unintentional careless actions (7 percent), open flame (6 percent), electrical malfunction (6 percent), and intentional actions (5 percent). Please exercise caution during the Halloween season and be fire safe.